


Sustainable Mobility: Electric Bikes for an Eco-Friendly Ride
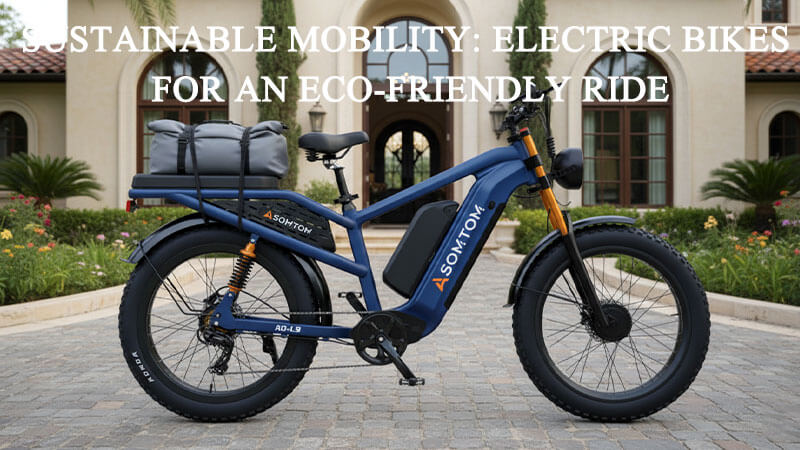
This article explains why e-bikes are a practical, low-carbon transportation option for U.S. commuters and everyday riders. You will learn what sets these pedal-assist machines apart from standard bikes and why the added boost expands who can ride without removing the need to pedal.
Data shows an average energy use near 11 Wh per mile and lifecycle emissions far below a small car. Manufacturing an e-bike emits roughly 134–165 kg CO2e versus about 5.5 tons for a compact car. Per-mile output can be as low as 3–8 g CO2, compared with roughly 240 g per passenger mile by car.
The guide will cover emissions, lifecycle impact, city health benefits, buying advice, costs, maintenance, and policy needs. Expect practical comparisons of e-bikes versus cars, how these machines pair with transit, and how cleaner grids improve long-term impact.

Why E-Bikes Matter Now: The Future of Sustainable Transportation in the U.S.
Shifting short and medium trips from cars to pedal-assist transport cuts per-mile emissions dramatically. Typical e-bike emissions range from about 3.2 to 8 g CO2 per mile, compared with roughly 240 g per passenger mile for cars. That gap makes a clear case for mobility change.
These machines fit into a multimodal system, linking neighborhoods to transit hubs and making first/last-mile travel easier for riders of varied abilities.
Key Benefits:
-
Lower greenhouse emissions per mile as grids get cleaner
-
Thousands of miles swapped from cars each year, multiplying savings
-
Improved access to jobs and services without more vehicles in congested corridors
-
Public health gains from regular, manageable activity
| Mode | Approx. CO2 (g/mi) | Annual miles replaced |
|---|---|---|
| Pedal-assist | 3.2–8 | 1,000–5,000 |
| Car (passenger) | ~240 | 1,000–5,000 |
| Public transit (avg) | 80–176 | Varies |
Real-world Emissions: 3.2–8 g CO2 per mile vs. ~240 g for cars
Charging in regions with more renewables pushes e-bike emissions to the low end of the range.
Energy Efficiency: ~11 Wh/mi for e-bikes vs. 250–500 Wh/mi for EVs and 1,500–2,500 Wh/mi for cars
| Mode | Energy (Wh/mi) | Typical CO2 (g/mi) |
|---|---|---|
| Pedal-assist | ~11 | 3.2–8 |
| EV (passenger) | 250–500 | Varies by grid |
| Car (gas) | 1,500–2,500 | ~240 |

From Factory to Finish: The Environmental Impact Across an E-Bike’s Lifecycle
Manufacturing an e-bike releases about 134–165 kg CO2e, compared with 5.5 tons for a small car.
Materials and production cause most of that footprint.
-
Recycling and take-back programs recover metals and cut lifecycle impacts.
-
Proper charging and cool storage extend battery life.
-
Solar charging further reduces use-phase emissions.
Learn About 48V 20Ah LG Battery Adult 3-Wheel Cargo Ebike WHALE 2.0
Cleaner Cities, Healthier Commutes: E-Bikes, Air Quality, and Traffic Congestion
Zero tailpipe emissions mean cleaner air and calmer streets. Protected bike lanes and smaller vehicle footprints cut congestion, noise, and pollution.
| Impact | Mechanism | Result |
|---|---|---|
| Air quality | Zero tailpipe at use | Lower NOx and particulates |
| Traffic congestion | Small vehicle footprint | Faster flow, less gridlock |
| Equity & access | Assist reduces barriers | Wider mobility choice |

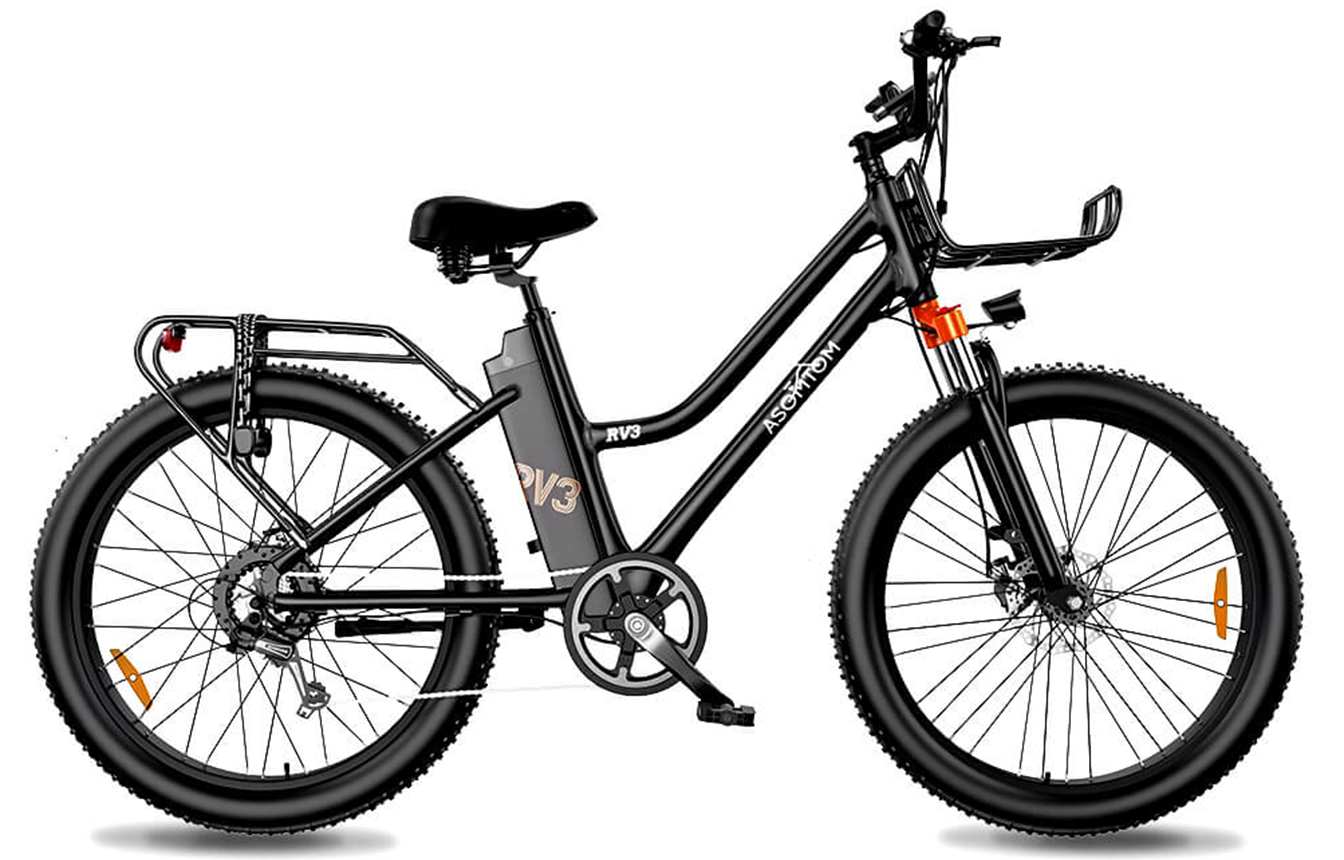
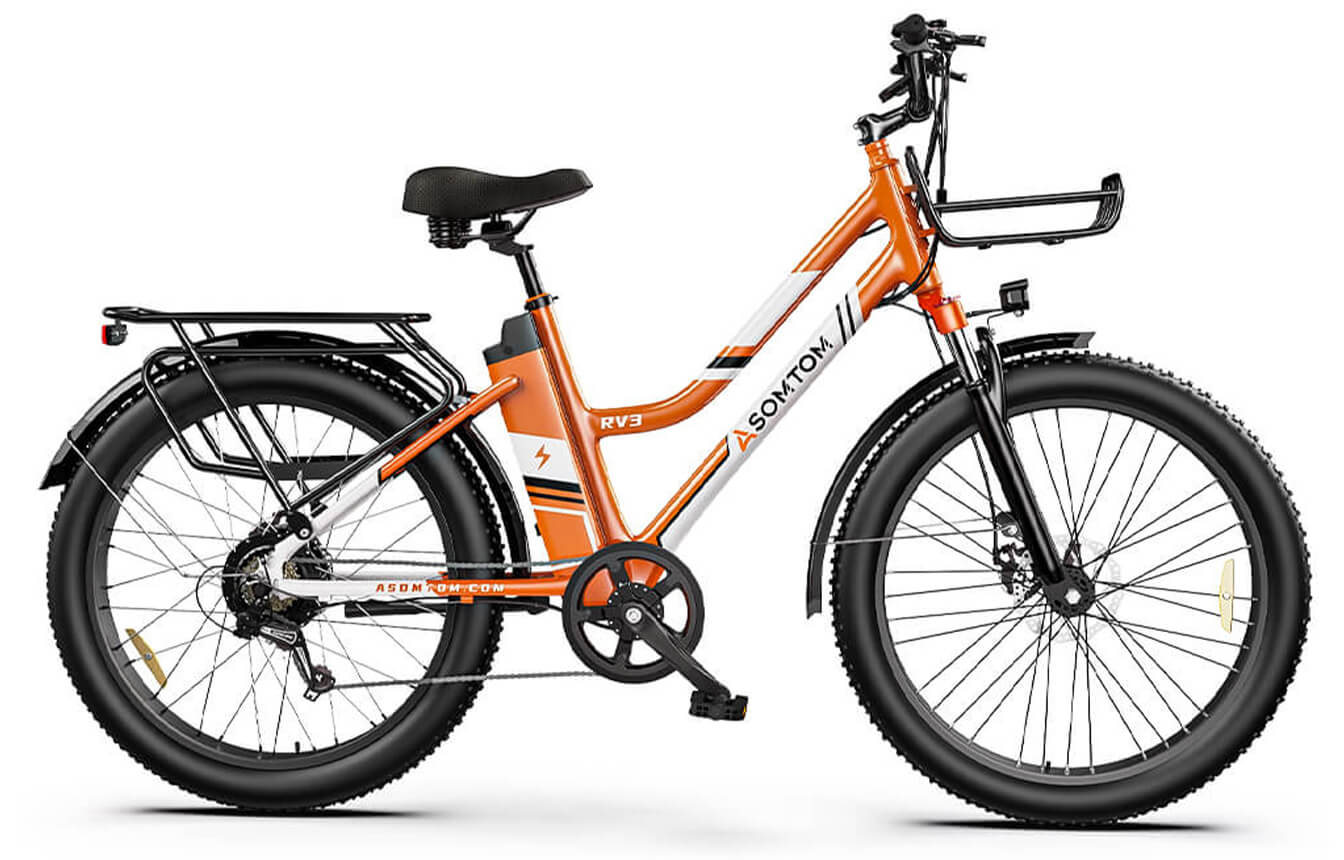
Choosing the Right E-Bike for Sustainability and Everyday Use
City/commuter and folding models are ideal for short trips; cargo e-bikes handle family or delivery duties.
Typical batteries: 300–400 Wh → 25–60 miles range.
-
Motor/controller: 36V 15A (~540W) suits most riders
-
Setup tips: proper tires, racks, fenders, and serviceable parts
Costs, Savings, and Maintenance: The Practical Case for E-Bikes Over Cars
Charging costs under $0.01/mi, maintenance is simple, and ownership costs are far below car ownership.
| Item | Annual Cost | Notes |
|---|---|---|
| Charging | $10–$50 | Based on mileage |
| Maintenance | $50–$200 | Regular parts |
| Car ownership | $3,000–$7,000 | Fuel, insurance, parking |
Routine service—tires, brakes, chain—keeps performance high and costs low.
Infrastructure and Policy: What the U.S. Needs for Mass E-Bike Adoption
Connected bike lanes, secure parking, and incentives accelerate adoption.
| Priority | Action | Expected Outcome |
|---|---|---|
| Protected network | Continuous lanes | Higher ridership |
| Secure parking | Indoor lockers | Reduced theft |
| Charging & incentives | Workplace outlets | Broader adoption |
"Clear rules, incentives, and reliable infrastructure unlock sustainable mobility."
Conclusion
Modern e-bikes combine low power use (~11 Wh/mi), low emissions (3–8 g CO2/mi), and easy upkeep to make sustainable transport practical.
A matched model, regular maintenance, and recycling habits amplify both economic and environmental benefits.
Leave a comment